Firebase Performance
Gain insight into your app's performance issues.
Firebase Performance Monitoring is a service that helps you to gain insight into the performance characteristics of your iOS or Android application.
Firebase Performance is enabled by default and records default metrics about your application automatically. After the first app launch, allow up to 30 minutes to see data in the Firebase Console.
Add custom monitoring for specific app code
Performance Monitoring collects traces to help you monitor the performance of your app. A trace is a report of performance data captured between two points in time in your app.
You can create your own traces to monitor performance data associated with specific code in your app. With a custom code trace, you can measure how long it takes your app to complete a specific task or a set of tasks, for example loading a set of images or querying your database.
The default metric for a custom code trace is its "duration" (the time between the starting and stopping points of the trace), but you can add custom metrics, as well.
In your code, you define the beginning and the end of a custom code trace using the APIs provided by the Performance Monitoring SDK. Custom code traces can be started anytime after they've been created, and they are thread safe.
Since the default metric collected for these traces is "duration", they are sometimes called "Duration traces".
You can view data from these traces in the Custom traces subtab of the traces table, which is at the bottom of the Performance dashboard (learn more about using the console later on this page).
Note: Starting and stopping traces too rapidly can be resource intensive, so you should avoid creating custom code traces at high frequencies (for example, once per frame in games).
Default attributes, custom attributes, and custom metrics
For custom code traces, Performance Monitoring automatically logs default attributes (common metadata like app version, country, device, etc.) so that you can filter the data for the trace in the Firebase console. You can also add and monitor custom attributes (such as, game level or user properties). You can further configure a custom code trace to record custom metrics for performance-related events that occur within the trace's scope. For example, you can create a custom metric for the number of cache hits and misses or the number of times that the UI becomes unresponsive for a noticeable period of time.
Custom attributes and custom metrics display in the Firebase console alongside the default attributes and default metric for the trace.
An attribute is a string value that helps you filter and segment data in the console. A metric is a numeric value that can be charted and measured over time.
Add custom code traces
Use the Performance Monitoring Trace API to add custom code traces to monitor specific application code.
Note the following:
- An app can have multiple custom code traces.
- More than one custom code trace can run at the same time.
- Names for custom code traces must meet the following requirements: no leading or trailing whitespace, no leading underscore (_) character, and max length is 100 characters.
- Custom code traces support adding custom metrics and custom attributes.
To start and stop a custom code trace, wrap the code that you want to trace with lines of code similar to the following:
#include "Performance/FirebasePerformanceLibrary.h"
// Creates and starts the trace.
FFirebaseTrace Trace = UFirebasePerformanceLibrary::CreateAndStartTrace(TEXT("CUSTOM_TRACE_NAME"));
/* Code to trace */
// Stops the task.
Trace.Stop();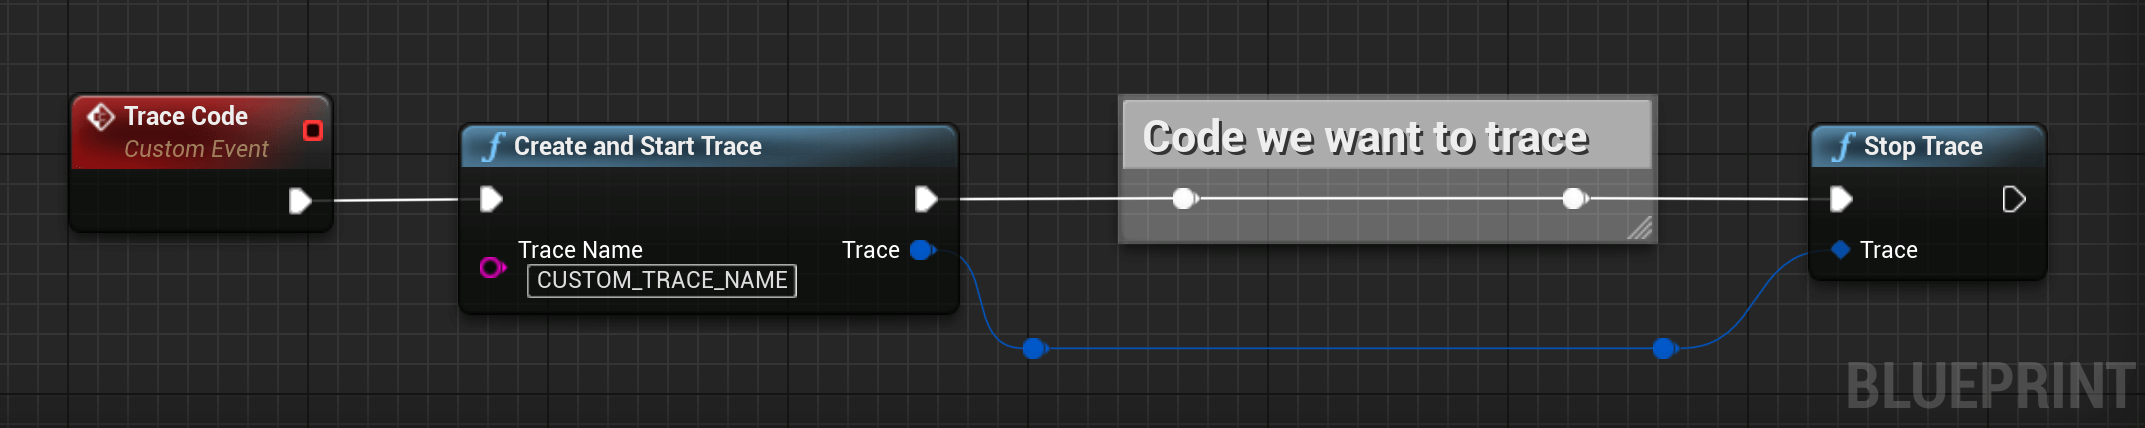
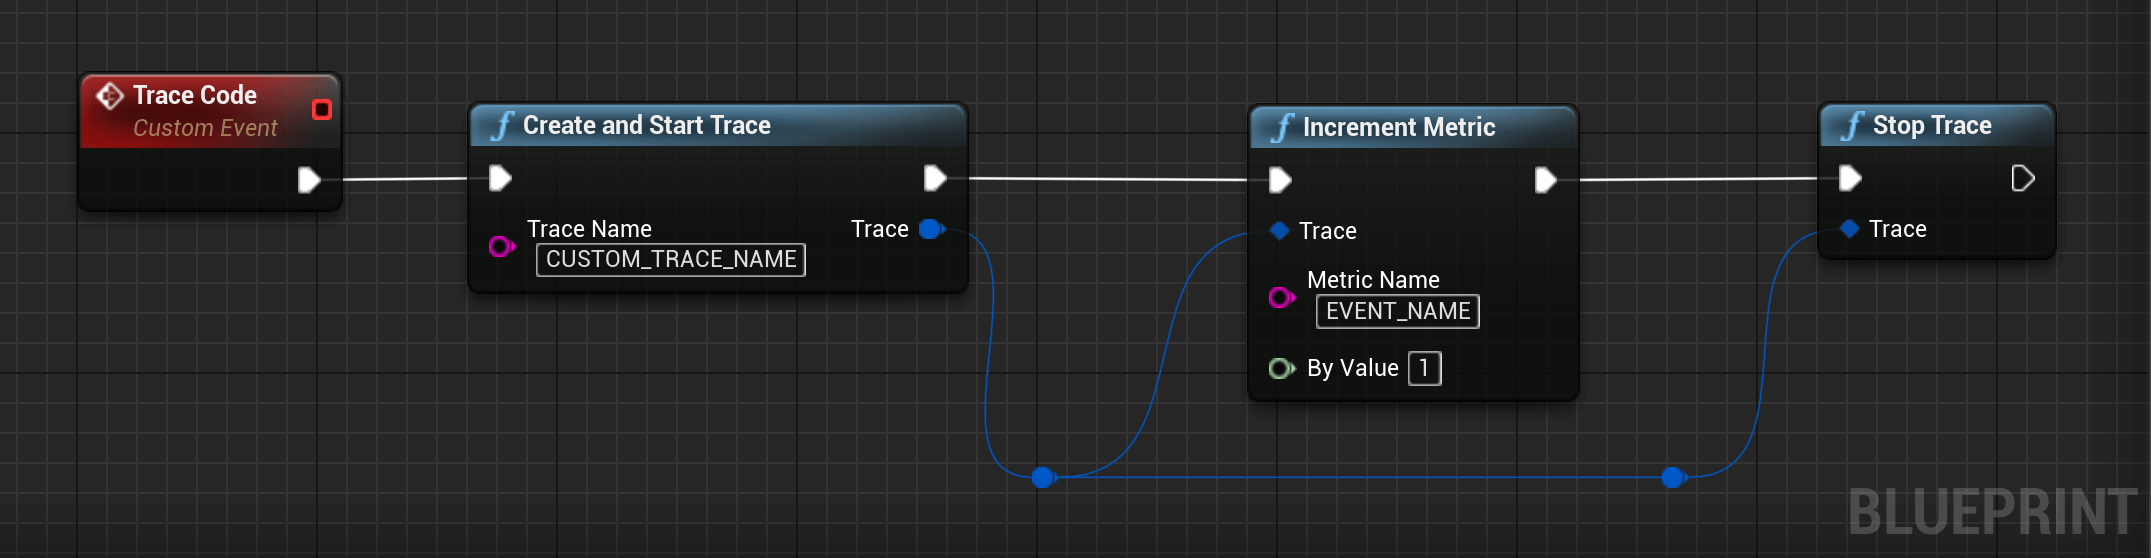
Add custom metrics to custom code traces
Use the Performance Monitoring Trace API to add custom metrics to custom code traces.
Note the following:
- Names for custom metrics must meet the following requirements: no leading or trailing whitespace, no leading underscore (_) character, and max length is 100 characters.
- Each custom code trace can record up to 32 metrics (including the default Duration metric). To add a custom metric, add a line of code similar to the following each time that the event occurs. For example, this custom metric counts performance-related events that occur in your app, such as cache hits or retries.
// Creates and starts the trace.
FFirebaseTrace Trace = UFirebasePerformanceLibrary::CreateAndStartTrace(TEXT("CUSTOM_TRACE_NAME"));
// We increment our metric by 1.
Trace.IncrementMetric(TEXT("EVENT_NAME"), /* ByValue */ 1);
/* Code to trace */
// Stops the task.
Trace.Stop();